Influence line diagrams spreadsheet
Influence line diagrams spreadsheet calculates influence line diagrams for bending moments in a single span or
continuous multi-span beam using the moment distribution method.
INSTRUCTIONS
If Enter data in the yellow cells only.
2. Enter the Span Length for each span. Any number of spans may be analysed up to a maximum of IO. Any ofthe
I0 spans not used will be removed when the "Calculate Critical Points” button is clicked I (Note; The print-out for
more than 8 spans requires the paper orientaton to be set to ‘Landscape')_
3; Enter Modulus of Elasticity (E) multiplied by the Second Moment of Area (I) for each span. Relative values of El
may be used, for example, ifthe beam is of the same material and cross section throughout then a value of I
may be entered for El for each span.
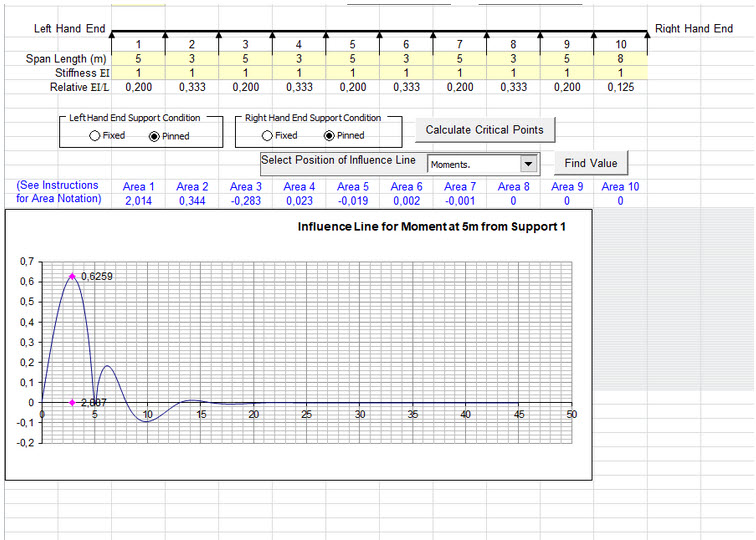
4; Select the End Support Conditions (Fixed or Pinned) by clicking the option buttons.
5; Click the "Calculate Critical Points" button to analyse the beam to determinine the position of the maximum
sagging moment in each span and the position of the load to give the maximum hogging moments at each
supprt_ The results are displayed in a drop-down menu labelled "Moments"_
6; Select the position of the Influence Line you require from the drop-down menu which will be displayed on the
graph below. If you require an Influence Line for any other position on the beam then select “User Defined" from
the menu and enter the distance ofthe required position from the left hand end of the beam.
7; The 'Areas' shown are the individual areas of the influence line diagram numbered in sequence from left to right
as shown:
8; If a value of the influence line diagram is required at a specific distance along the structure then click the ‘Find
Value' button. The distance is measured from the left hand end of span I.
* Influence Line Diagrams download link provides freeware version of the softwares
Influence line diagrams spreadsheet calculates influence line diagrams for bending moments in a single span or
continuous multi-span beam using the moment distribution method.
INSTRUCTIONS
If Enter data in the yellow cells only.
2. Enter the Span Length for each span. Any number of spans may be analysed up to a maximum of IO. Any ofthe
I0 spans not used will be removed when the "Calculate Critical Points” button is clicked I (Note; The print-out for
more than 8 spans requires the paper orientaton to be set to ‘Landscape')_
3; Enter Modulus of Elasticity (E) multiplied by the Second Moment of Area (I) for each span. Relative values of El
may be used, for example, ifthe beam is of the same material and cross section throughout then a value of I
may be entered for El for each span.
4; Select the End Support Conditions (Fixed or Pinned) by clicking the option buttons.
5; Click the "Calculate Critical Points" button to analyse the beam to determinine the position of the maximum
sagging moment in each span and the position of the load to give the maximum hogging moments at each
supprt_ The results are displayed in a drop-down menu labelled "Moments"_
6; Select the position of the Influence Line you require from the drop-down menu which will be displayed on the
graph below. If you require an Influence Line for any other position on the beam then select “User Defined" from
the menu and enter the distance ofthe required position from the left hand end of the beam.
7; The 'Areas' shown are the individual areas of the influence line diagram numbered in sequence from left to right
as shown:
8; If a value of the influence line diagram is required at a specific distance along the structure then click the ‘Find
Value' button. The distance is measured from the left hand end of span I.
* Influence Line Diagrams download link provides freeware version of the softwares